This node 571507 is published parle_debug=field_parle_speak boolean = FALSE (unchecked or not configured)
Air travel complaints per 100 flights – by airline – April 2022 to March 2023
Context
- The tables include airlines with an average of 1 or more complaints per 100 flights to/from/within Canada submitted to the CTA during 1 of the quarterly periods. Airlines that did not meet this criteria, or that did not operate at least 100 flights over the reporting periods, are not included on the list.
- The complaint data is based on the information submitted by passengers and may not have been reviewed by the CTA at the time of publishing.
- Complaints are submitted to the CTA after the passenger has attempted to resolve the issue directly with the airline. Airlines have 30 days to respond to the passenger.
- The data is based on the number of flights by airline and does not reflect the number of passengers per flight or the size of the aircraft.
- The data used for this dashboard is based on all of the air travel complaints submitted to the CTA; the numbers do not imply whether or not an airline actually met its regulatory requirements.
- Most complaints (97%) are resolved informally through facilitation or mediation; other complaints move to a formal adjudication process.
- Airlines identified in the complaint may change based on the information supplied by the passenger and the airline during the complaint review process.
- Complaints related to accessibility are not included in these tables.
Number of complaints per 100 flights operated by Canadian airlines
April 1, 2022 – March 31, 2023, by quarter
| Airline | Year to date average (Apr. 2022 – Mar. 2023) |
Jan. 1 – Mar. 31, 2023 | Oct. 1 – Dec. 31, 2022 | July 1 – Sept. 30, 2022 | April 1 – June 30, 2022 |
|---|---|---|---|---|---|
| Air Canada | 4.3 | 5.8 | 4.1 | 6.3 | 1.0 |
| Air Transat A.T. Inc. | 3.3 | 4.4 | 4.4 | 2.9 | 1.4 |
| Flair Airlines Ltd. | 15.3 | 20.9 | 12.8 | 18.0 | 9.3 |
| Lynx Air | 5.4 | 5.2 | 6.5 | 7.4 | 2.3 |
| Sunwing Airlines Inc. | 13.8 | 17.4 | 20.7 | 9.3 | 7.8 |
| Swoop Inc. | 13.2 | 16.0 | 11.4 | 18.5 | 6.7 |
| Westjet | 6.6 | 10.7 | 5.6 | 6.0 | 3.9 |
View as a graph

Source: The complaints data is compiled by the CTA. The number of flights operated per airline during the time period is provided by a third party (Cirium).
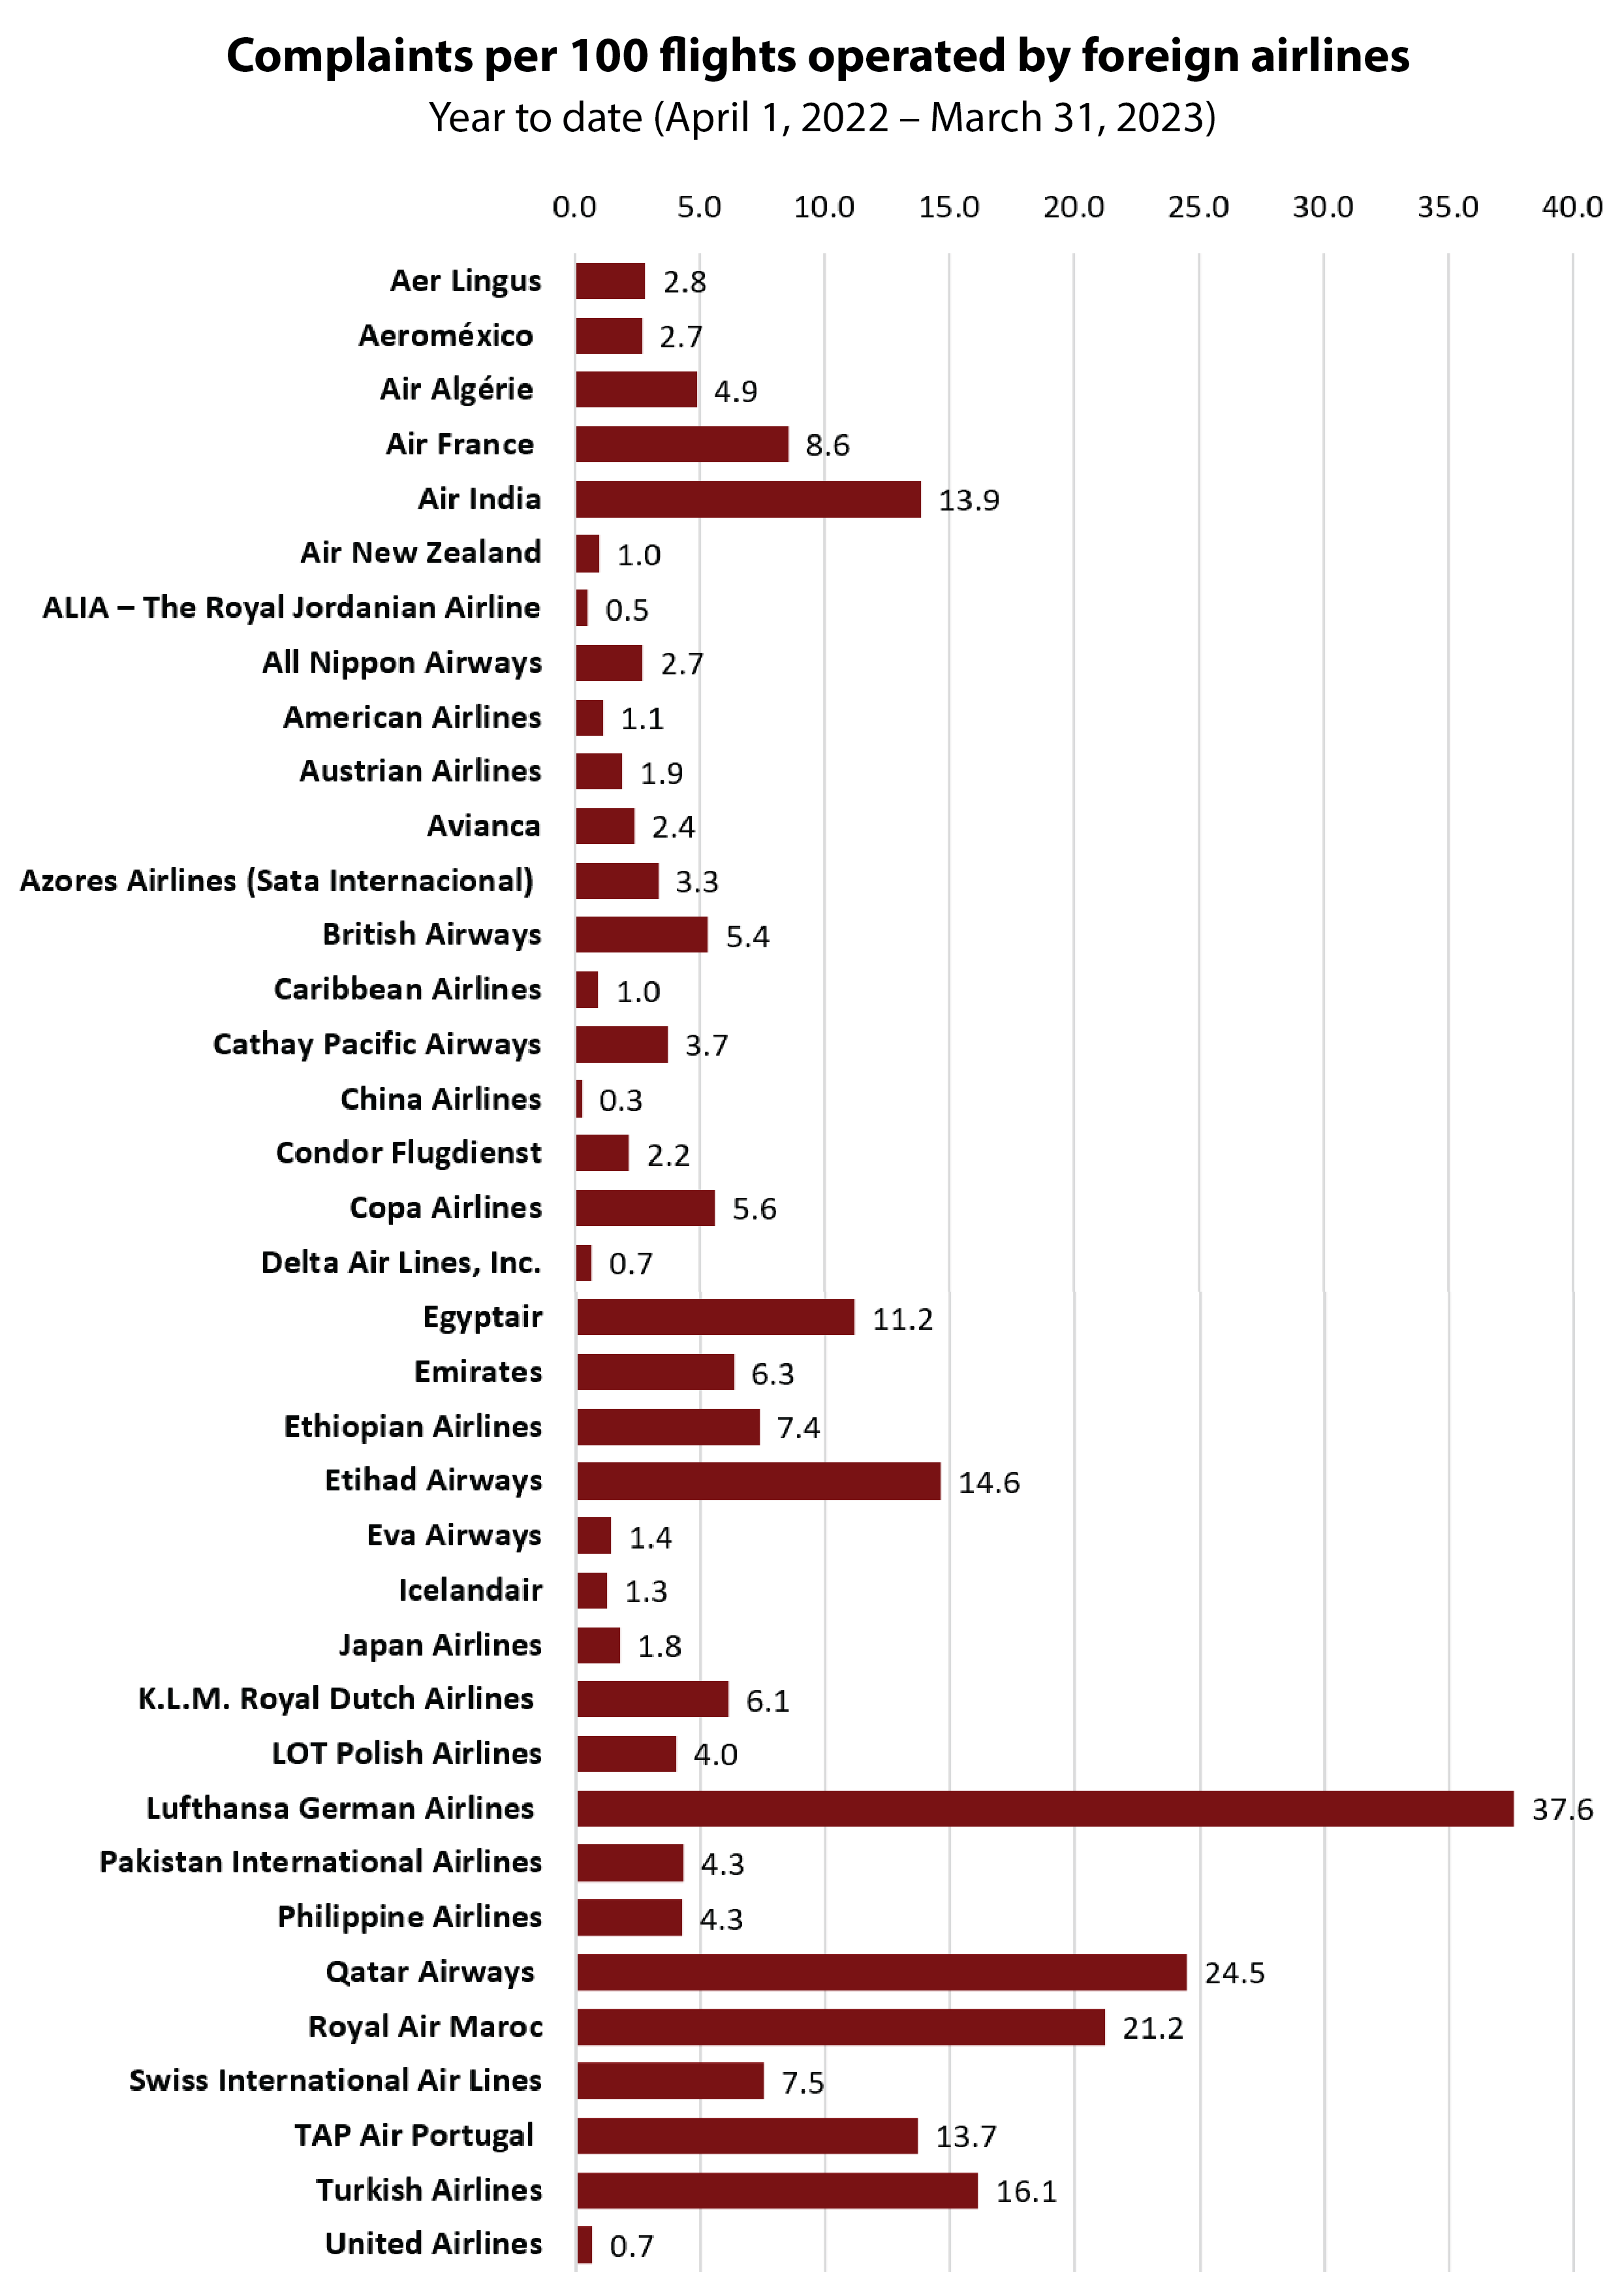
Number of complaints per 100 flights operated by foreign airlines
April 1, 2022 – March 31, 2023, by quarter
| Airline | Year to date average (Apr. 2022 – Mar. 2023) |
Jan. 1 – Mar. 31, 2023 | Oct. 1 – Dec. 31, 2022 | July 1 – Sept. 30, 2022 | April 1 – June 30, 2022 |
|---|---|---|---|---|---|
| Aer Lingus Limited | 2.8 | 4.3 | 1.3 | 4.7 | 1.0 |
| Aeroméxico – Aerovias de Mexico S.A. de C.V. | 2.7 | 3.3 | 2.1 | 2.8 | 2.5 |
| Air Algérie – EPE SPA Air Algérie | 4.9 | 13.0 | 1.6 | 2.4 | 2.5 |
| Air France – Société Air France | 8.6 | 13.1 | 10.7 | 7.7 | 2.7 |
| Air India Limited | 13.9 | 14.7 | 13.3 | 15.2 | 12.2 |
| Air New Zealand Limited | 1.0 | 2.1 | 1.8 | — | — |
| ALIA – The Royal Jordanian Airline plc | 0.5 | — | — | 2.1 | — |
| All Nippon Airways Co., Ltd. | 2.7 | 3.3 | 5.3 | 2.3 | — |
| American Airlines, Inc. | 1.1 | 1.6 | 1.4 | 1.5 | — |
| Austrian Airlines, AG | 1.9 | — | — | 5.9 | 1.7 |
| Avianca – Aerovias del Continente Americano S.A. | 2.4 | 3.4 | 2.4 | 1.1 | 2.6 |
| Azores Airlines (Sata Internacional) – Serviços e Transportes Aéreos, S.A. | 3.3 | 6.6 | 3.4 | 1.9 | 1.4 |
| British Airways Plc | 5.4 | 6.3 | 5.9 | 7.2 | 2.0 |
| Caribbean Airlines Limited | 1.0 | 2.5 | — | — | 1.3 |
| Cathay Pacific Airways Limited | 3.7 | 4.9 | 4.1 | 5.8 | — |
| China Airlines Limited | 0.3 | 1.1 | — | — | — |
| Condor Flugdienst GmbH | 2.2 | — | — | 6.1 | 2.6 |
| Copa Airlines – Compañia Panameña de Aviacion, S.A. | 5.6 | 7.3 | 6.6 | 4.5 | 4.1 |
| Delta Air Lines | 0.7 | 1.5 | 1.2 | — | — |
| Egyptair | 11.2 | 11.9 | 11.4 | 13.9 | 7.5 |
| Emirates | 6.3 | 7.0 | 5.9 | 6.6 | 5.8 |
| Ethiopian Airlines Enterprise | 7.4 | 9.4 | 8.9 | 5.2 | 5.9 |
| Etihad Airways P.J.S.C. | 14.6 | 18.1 | 14.5 | 15.6 | 10.3 |
| Eva Airways Corporation | 1.4 | 3.9 | 1.8 | — | — |
| Icelandair | 1.3 | 3.6 | 1.4 | — | — |
| Japan Airlines | 1.8 | 5.0 | 2.1 | — | — |
| K.L.M. Royal Dutch Airlines – Koninklijke Luchtvaart Maatschappij, N.V. | 6.1 | 9.6 | 8.0 | 3.8 | 3.1 |
| LOT Polish Airlines SA – Polskie Linie Lotnicze LOT SA | 4.0 | 4.3 | 5.1 | 4.6 | 2.1 |
| Lufthansa German Airlines – Deutsche Lufthansa Aktiengesellschaft | 37.6 | 84.6 | 48.6 | 12.6 | 4.6 |
| Pakistan International Airlines Corporation | 4.3 | 11.5 | 4.3 | 1.5 | — |
| Philippine Airlines, Inc. | 4.3 | 6.3 | 4.1 | 3.7 | 3.0 |
| Qatar Airways (Q.C.S.C.) | 24.5 | 26.3 | 23.4 | 29.9 | 18.3 |
| Royal Air Maroc – Compagnie Nationale Royal Air Maroc | 21.2 | 32.8 | 25.4 | 14.2 | 12.4 |
| Swiss International | 7.5 | 11.5 | 11.0 | 7.6 | — |
| TAP Air Portugal – Transportes Aéreos Portugueses, S.A. | 13.7 | 17.7 | 13.2 | 12.9 | 11.0 |
| Turkish Airlines Inc. – Türk Hava Yollari Anonim Ortakligi | 16.1 | 20.3 | 14.8 | 16.0 | 13.4 |
| United Airlines | 0.7 | 1.7 | 1.0 | — | — |
View as a graph
Source: The complaints data is compiled by the CTA. The number of flights operated per airline during the time period is provided by a third party (Cirium).
- Date modified: