Air travel complaints per 100 flights – by airline – October 2024 to September 2025
Context
The tables include airlines with an average of 1 or more complaints per 100 flights to/from/within Canada submitted to the CTA during one of the quarterly periods. Airlines that did not meet these criteria, or that did not operate at least 100 flights over the reporting periods, are not included on the list.
The complaints data reflects information submitted by passengers after unsuccessful resolution with airlines. Submissions may not have been reviewed by the Complaint Resolution Office at the time of publication, and inclusion does not necessarily reflect any airline’s non-compliance with regulatory requirements. Data from previous quarters is adjusted when complaints are identified as incorrect submissions.
The data is based on the number of flights by airline and does not reflect the number of passengers per flight or the size of the aircraft.
Complaints related to accessibility are not included in these tables.
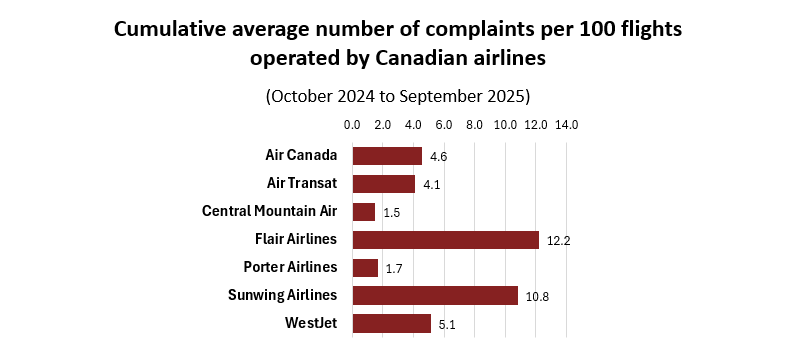
Number of complaints per 100 flights operated by Canadian airlines
October 2024 to September 2025, by quarter
| Airline | FY 2025–26 | FY 2024–25 | Average | ||
|---|---|---|---|---|---|
| July to September (Q2) |
April to June (Q1) |
January to March (Q4) |
October to December (Q3) |
||
| Air Canada | 4.3 | 4.1 | 5.7 | 4.2 | 4.6 |
| Air Transat | 3.9 | 4.2 | 3.6 | 4.8 | 4.1 |
| Central Mountain Air | — | — | — | 1.5 | 1.5 |
| Flair Airlines | 8.3 | 10.4 | 16.5 | 13.5 | 12.2 |
| Porter Airlines | 1.8 | 1.8 | 1.9 | 1.1 | 1.7 |
| Sunwing Airlines | — | — | 16.0 | 5.6 | 10.8 |
| WestJet | 3.8 | 3.9 | 6.8 | 6.0 | 5.1 |
|
Source: The complaints data is compiled by the CTA. The number of flights operated per airline during the time period is provided by a third party source—Cirium. |
|||||
Bar graph: cumulative average number of complaints per 100 flights operated by Canadian airlines from October 2024 to September 2025
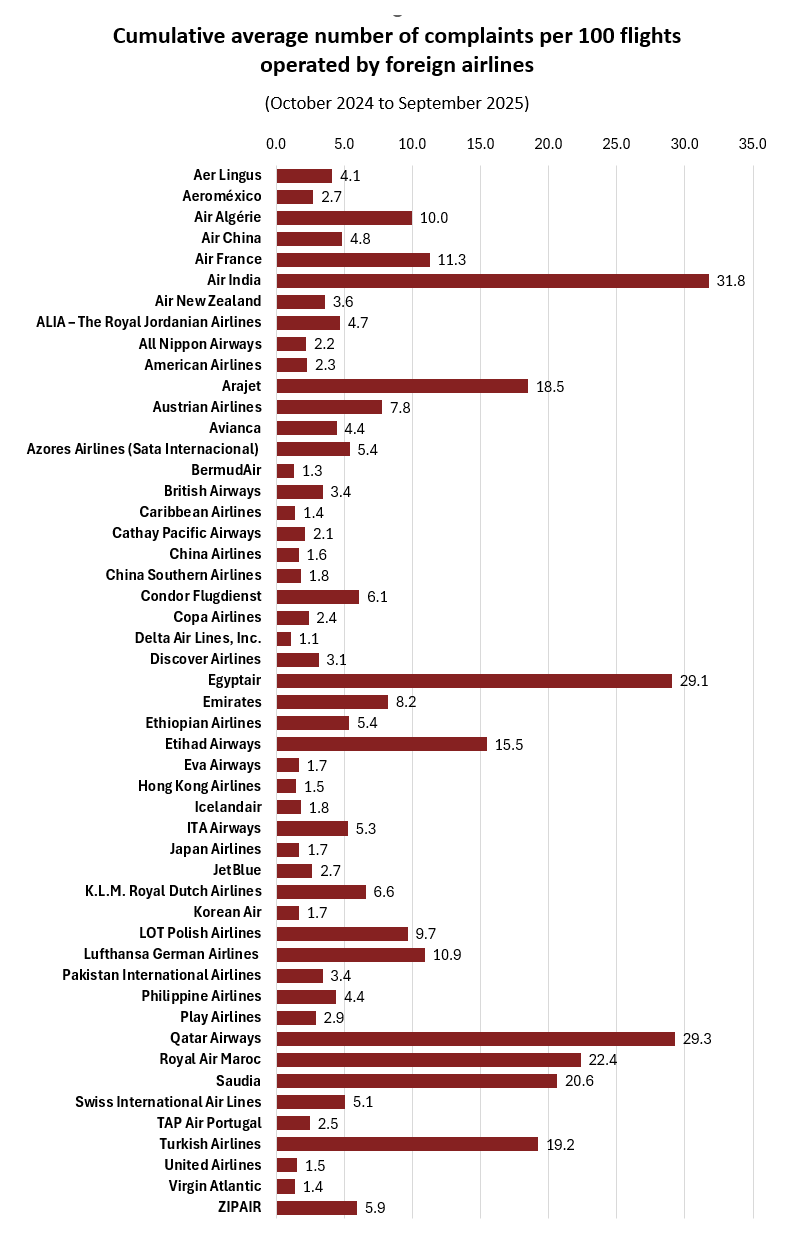
Number of complaints per 100 flights operated by foreign airlines
October 2024 to September 2025, by quarter
| Airline | FY 2025–26 | FY 2024–25 | Average | ||
|---|---|---|---|---|---|
| July to September (Q2) |
April to June (Q1) |
January to March (Q4) |
October to December (Q3) |
||
| Aer Lingus | 1.6 | 5.5 | 3.7 | 5.6 | 4.1 |
| Aeroméxico | 2.9 | 2.2 | 3.1 | 2.7 | 2.7 |
| Air Algérie | 8.5 | 13.6 | 7.4 | 10.3 | 10.0 |
| Air China | 4.8 | 5.8 | 3.9 | — | 4.8 |
| Air France | 8.0 | 7.4 | 15.6 | 14.0 | 11.3 |
| Air India | 54.6 | 27.6 | 23.0 | 21.8 | 31.8 |
| Air New Zealand | 1.7 | 5.0 | 5.7 | 1.9 | 3.6 |
| ALIA – The Royal Jordanian Airlines | 4.1 | 4.4 | 4.6 | 5.6 | 4.7 |
| All Nippon Airways | — | — | 2.2 | — | 2.2 |
| American Airlines | 2.1 | 2.4 | 2.8 | 1.8 | 2.3 |
| Arajet | 23.9 | 24.3 | 16.9 | 8.8 | 18.5 |
| Austrian Airlines | 5.5 | 4.2 | 10.8 | 10.6 | 7.8 |
| Avianca | 3.7 | 4.3 | 5.4 | 4.3 | 4.4 |
| Azores Airlines (Sata Internacional) | 4.2 | 2.0 | 4.6 | 10.7 | 5.4 |
| BermudAir | — | 1.3 | — | — | 1.3 |
| British Airways | 1.7 | 2.2 | 4.1 | 5.6 | 3.4 |
| Caribbean Airlines | — | 1.4 | — | — | 1.4 |
| Cathay Pacific Airways | 3.6 | 1.8 | 1.7 | 1.4 | 2.1 |
| China Airlines | — | 1.1 | 1.1 | 2.7 | 1.6 |
| China Southern Airlines | 1.7 | 1.9 | — | — | 1.8 |
| Condor Flugdienst | 3.7 | 2.0 | — | 12.6 | 6.1 |
| Copa Airlines | 1.6 | 2.2 | 3.3 | — | 2.4 |
| Delta Air Lines, Inc. | 1.0 | — | 1.2 | 1.0 | 1.1 |
| Discover Airlines | — | — | — | 3.1 | 3.1 |
| Egyptair | 26.9 | 32.6 | 26.2 | 30.5 | 29.1 |
| Emirates | 8.5 | 8.6 | 9.7 | 6.0 | 8.2 |
| Ethiopian Airlines | 3.8 | 3.8 | 8.9 | 4.9 | 5.4 |
| Etihad Airways | 19.7 | 12.1 | 17.1 | 12.9 | 15.5 |
| Eva Airways | 1.6 | 2.2 | 1.4 | 1.4 | 1.7 |
| Hong Kong Airlines | 1.1 | 1.8 | — | — | 1.5 |
| Icelandair | 1.2 | — | 2.9 | 1.3 | 1.8 |
| ITA Airways | 5.0 | 5.5 | — | — | 5.3 |
| Japan Airlines | — | — | 1.7 | — | 1.7 |
| JetBlue | 2.6 | — | — | 2.7 | 2.7 |
| K.L.M. Royal Dutch Airlines | 4.4 | 4.4 | 9.7 | 7.8 | 6.6 |
| Korean Air | — | 1.3 | 1.9 | 1.8 | 1.7 |
| LOT Polish Airlines | 4.6 | 8.4 | 10.8 | 14.8 | 9.7 |
| Lufthansa German Airlines | 7.3 | 7.6 | 12.9 | 15.8 | 10.9 |
| Pakistan International Airlines | — | 3.0 | — | 3.8 | 3.4 |
| Philippine Airlines | 4.2 | 3.9 | 2.8 | 6.7 | 4.4 |
| Play Airlines | — | 3.8 | 3.8 | 2.0 | 2.3 |
| Qatar Airways | 25.6 | 22.0 | 39.6 | 29.9 | 29.3 |
| Royal Air Maroc | 12.9 | 26.0 | 21.6 | 29.3 | 22.4 |
| Saudia | 16.0 | 19.2 | 26.5 | 20.8 | 20.6 |
| Swiss International Air Lines | 4.1 | 1.9 | 6.1 | 8.1 | 5.1 |
| TAP Air Portugal | 3.9 | 1.9 | 1.8 | 2.3 | 2.5 |
| Turkish Airlines | 15.8 | 17.4 | 24.0 | 19.7 | 19.2 |
| United Airlines | 1.8 | 1.4 | 1.5 | 1.4 | 1.5 |
| Virgin Atlantic | 1.1 | 1.6 | — | — | 1.4 |
| ZIPAIR | 1.4 | 2.7 | 7.3 | 12.3 | 5.9 |
|
Source: The complaints data is compiled by the CTA. The number of flights operated per airline during the time period is provided by a third party source—Cirium. |
|||||
Bar graph: cumulative average number of complaints per 100 flights operated by foreign airlines from October 2024 to September 2025
- Date modified: